

Why home prices are holding steady despite higher rates
Home prices have remained firm over the last two months, even with higher mortgage rates and inventory data. Our weekly tracker data is created to look ahead of the traditional monthly reports such as Case Shiller and the NAR existing home sales report, and what I have seen over the past few weeks has shocked me.
I want to show you how the data changed with mortgage rates heading toward 6% so the next time this happens, we have a better idea of what to expect in the housing market.
Deviation In the data
I aim to determine what level of mortgage rates we need to change the demand curve, which can also change the pricing curve in housing data. I have long believed that it’s rare in the U.S. after 1996 to have existing home sales trend below 4 million. We have had a few months in which we have gotten below this level, but nothing too drastic.
Back on Nov. 9, 2022, I showed how housing dynamics shifted by tracking forward-looking data. This podcast video is a tutorial on how to track this and why the 2023 housing price-crash people got it wrong because they have no working models. To this date, these principles still apply. Let’s take a look at what looks different today versus the past two years.
Pending contracts
First, we must realize that we are working with the third calendar year of the lowest home sales ever recorded, once you adjust that number to the workforce. It’s not like we have underwater mortgages or credit being tight either — this was the biggest crash ever and sales are still low.
This means we have a low bar of sales to work from because mortgage rates have been trending between 6%-8% for two years with rising prices, and we aren’t crashing in sales lower from these levels. So, when we look at the contract data, mortgage rates heading down toward 6% firmed the data up and the data is still showing a deviation from the levels we see from 2022 and 2023. This means the bottom-end sales are finding a firm base to work from.
<\/script>What I take from this is that we need 6% mortgage rates to grow sales with some sustainability. It won’t be spectacular, but we can grow and sustain higher sales rates at that level. We don’t need 3%, 4%, or even 5% mortgage rates, but just heading toward 6% and staying there can work.
If you want to see sales growth with some kick, you need sub-6% mortgage rates with duration, but since I can’t even forecast those levels yet, I am not going in that direction until the labor market breaks or the spreads get much better. I recently talked about this on CNBC. This is something to consider in the future. Every year, wages grow, more households are formed and if mortgage rates fall, it should create another positive demand curve data line of over 12 weeks. However, if mortgage rates can stay between 5.75%-6.25% for 12 months, it can sustain a higher sales level from the data we have seen since the end of 2022.
Purchase application data
Last week, purchase application data had a positive 5% week-to-week print and was up 10% year over year. However, remember that October had a shallow bar, so take the entire month showing positive year-over-year growth with some context. If I took the whole month of October, which was positive every week on a year-over-year basis, we averaged about 7.4% growth from last year.
<\/script>Let’s look at how this data line has acted so far this year.
When mortgage rates were running higher earlier in the year (between 6.75%-7.50%), this is what the purchase application data looked like:
- 14 negative prints
- 2 flat prints
- 2 positive prints
Since mortgage rates started falling in mid-June, here’s what purchase applications looked like:
- 12 positive prints
- 5 negative prints
- 1 flat print
- 3 straight positive year-over-year growth prints
With mortgage rates up again, here is where we are:
- 2 negative prints
- 1 positive weekly print
Here we can see a clear positive, forward-looking data line with mortgage rates heading toward 6%, and now this makes two times since late 2022 this has happened where demand gets better for over 12 weeks. I talked about the recent data being different in the HousingWire Daily podcast last week. But it isn’t just demand but also pricing.
Pricing data
Regarding price-cut data, many fake housing experts took information from other sources and didn’t know how to explain it correctly. This has been one of the most entertaining things to watch in 2024, by the way. They misread the price cut percentage and rising inventory data to mean that national home prices had to fall a lot this year. But we never had a proper deep negative pricing curve data line this year, and it’s November now.
However, this year, mortgage rates heading toward 6% facilitated the price cut percentage data to go lower earlier this year than in 2022 and 2023 data. Nothing is too dramatic here, but as you can see with the pending contact data, we have a rate variable that can change the data line even with rising housing inventory.
There were many years of housing data in the early to mid-1980s and mid to late 1990s, and even from 2000 to 2005, where we have seen rising inventory and sales. You can have rising inventory, increasing sales and rising prices. The price-cut percentage data is crucial if you know how to read it properly, and as you can see below, the price cut percentage data has slowed down recently.
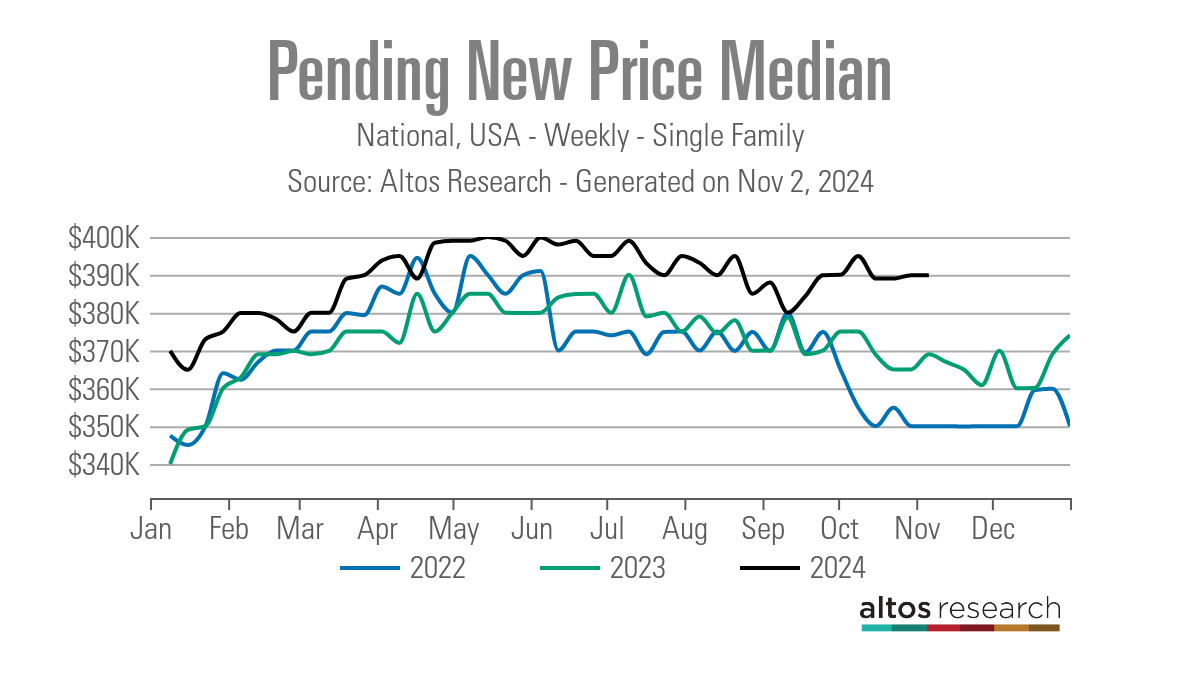
<\/script>What is shocking is that our weekly new pending price median data has firmed up even in a seasonally soft pricing period, especially now with higher inventory data. As you can see below, there is an apparent deviation from the 2022 and 2023 data. This is why my forecast for 2024 at 2.33% and home-price growth is at risk. If mortgage rates stayed near 6%, you wouldn’t have to be a rocket scientist to guess what the data line shows.
Weekly data lines
I am focusing on the deviation data in this weekend’s tracker, which is different than what we usually do; this is a quick look at the traditional data we show.
The weekly housing inventory did decline slightly. This is a back-to-back week of a minor decline in inventory. We have seen good growth in active listings data this year, so for those who said inventory can’t ever grow with higher rates, 2024 hopefully changed your mind.
Inventory fell from 736,014 to 735,718.
New listings data had a slight increase this week from 60,066 to 60,819.
<\/script>The positive story for 2024 so far is that inventory has grown. I wanted this to happen in 2023, but it happened too late to make a material change. However, for 2024, we’ve seen inventory growth and no new severe listing data from the new listings data in 2024. To give you some perspective on what stressed new listings look like, compare the 60,819 new listings data this week versus the data we saw this week during these years:
- 2009: 280,400
- 2010: 353,457
- 2011: 352,030
As I often say, we had different credit markets back then, so stop dancing with a ghost.
<\/script>10-year yield and mortgage rates
My 2024 forecast included:
- A range for mortgage rates between 7.25%-5.75%
- A range for the 10-year yield between 4.25%-3.21%
I will keep this as simple as possible. I have talked about this 4.40% line in the sand on the 10-year yield for some time now. If this level breaks higher, we have broken the downtrend in the 10-year yield that started on Oct. 16, 2023, when it was at 5%. We have a lot happening this week, so let’s watch this. If you’re confused about the bond market action on Jobs Friday, this article goes into my take on that.
<\/script>Mortgage spreads
Mortgage spreads had a good day on Friday, preventing pricing from worsening. However, the bigger story has been that the spreads getting better this year have been a positive for housing. If we had no improvement this year, rates could not only be higher today but all year. The spreads have gotten worse recently but are still better than last year.
<\/script>The week ahead: All bets are off
Between the election and the Fed meetings this week, all bets are off the table on anything being normal. I will be on the HousingWire Daily podcast three times this week to explain what is happening. Monday’s podcast will try to explain what is going on with the 10-year yield and mortgage rates.
For this week, the 4.40% level for bond yields is key; closing above that level and getting follow-through bond selling can be problematic for housing. However, try to ignore the intraday moves—they can be wild near critical technical levels. Good luck to everyone this week.
Categories
Recent Posts